Ask Real Estate - Orange County Housing Market Snapshot
Orange County Housing Market Snapshot
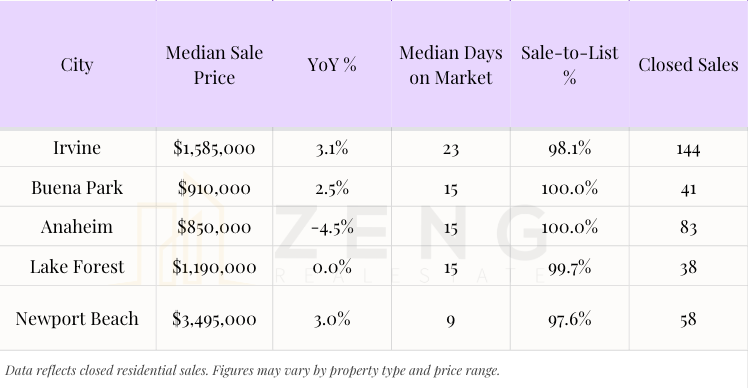
Key City Data | Updated Monthly
Email: myhome@zengrealestate.com
April 2026 Orange County Market Snapshot
Inventory across several Orange County cities increased this month, giving buyers slightly more options.
However, sales activity remained strong, partly supported by lower mortgage rates.
Overall, the market is showing signs of moving toward a more balanced environment, where buyers have more choices but well-priced homes still attract strong interest.
Data reflects closed sales through December 2025. This page is updated regularly.
This page provides a regularly updated snapshot of the Orange County housing market, with a focus on key cities buyers and sellers frequently ask about.
The data shown here reflects closed sales, not asking prices or headlines. It is intended to offer context—how pricing, timing, and buyer behavior are evolving across different parts of Orange County—rather than predictions about where the market “should” go next.
Because real estate conditions vary meaningfully by city and price range, this page highlights a small set of representative markets for comparison, including Irvine and select North and Central Orange County cities. The tables are updated periodically as new data becomes available.
Latest update: March 2026
How to Read This Market Snapshot
When reviewing the tables below, a few points are worth keeping in mind:
Median Sale Price reflects the midpoint of closed transactions, not list prices. It can shift based on the mix of homes sold in a given month.
Month-over-Month Change shows short-term momentum and can be volatile, especially during seasonal transitions.
Year-over-Year Change provides broader context but should be read alongside volume and days on market.
Days on Market often signals buyer behavior before prices adjust, particularly in shifting conditions.
Sale-to-List Price Ratio helps indicate negotiating dynamics, not just pricing strength.
No single metric tells the full story. Trends become clearer when these indicators are read together and interpreted in the context of local conditions.
Data source: MLS closed sales and active listings for selected Orange County cities.
Neutral City-by-City Interpretation Bullets
Irvine
Pricing remains relatively resilient compared to surrounding markets.
Longer days on market suggest buyers are more selective, particularly at higher price points.
Activity reflects a market driven by planning consistency rather than short-term momentum.
Buena Park
Price movement appears more sensitive to transaction mix than headline trends.
Days on market highlight a value-oriented buyer pool focused on practicality and access.
Sales volume suggests steady demand rather than speculative activity.
Anaheim
Market performance varies meaningfully by neighborhood and housing type.
Volume levels indicate ongoing liquidity, though pricing behavior is not uniform.
Buyer activity reflects a broad range of use cases, from owner-occupants to long-term investors.
Lake Forest
Pricing trends reflect mid-OC dynamics, balancing affordability and planning stability.
Days on market suggest measured buyer engagement rather than urgency.
Sales activity remains consistent with long-term residential demand.
Newport Beach
Pricing and sales patterns reflect discretionary, high-price-point decision-making.
Longer marketing timelines are common and do not necessarily indicate weak demand.
Activity is more influenced by buyer timing and preferences than by monthly shifts.
Orange County Housing Market Trends (2026)
What the latest data suggests
The Orange County housing market continues to show resilient demand despite fluctuations in mortgage rates. Inventory has increased slightly in recent months, giving buyers more options compared with earlier periods of tight supply.
However, sales activity in many cities remains strong, indicating that well-priced homes continue to attract serious buyers.
Cities such as Irvine still see consistent demand due to strong schools and master-planned communities, while cities like Anaheim and Buena Park continue to offer more accessible entry points into the Orange County market.
As interest rates shift, the market may gradually move toward a more balanced environment, where buyers have more choices while sellers of well-prepared homes can still achieve strong results.
📩 Stay Informed
Want the updated table when new data is published? Subscribe and I’ll send the latest snapshot.
No spam. Unsubscribe anytime.
Phone: (714) 902-3135
Email: myhome@zengrealestate.com